Mapping the Invisible: Understanding Community Topography in Social Networks
Recent Trends
In the last several quarters, platform researchers and independent analysts have shifted focus from raw network size to the structural patterns that define how online communities form, interact, and dissolve. Terms such as "echo chambers," "bridge nodes," and "affinity clusters" have entered mainstream discussion as social platforms introduce features that expose—or obscure—the invisible landscapes of user relationships. A growing number of studies point to a trend where algorithmic curation creates topographical features (ridges, valleys, and isolated peaks) that shape information flow more than individual user intent.

- Increased deployment of graph-based recommendation systems that prioritize cluster cohesion over diverse exposure.
- Rise of "third-place" communities—smaller, topic-specific groups that form within larger platforms, often around shared routines or tools.
- Platforms experimenting with visibility controls that let users see the "shape" of their own network (e.g., how many mutual connections connect distinct friend groups).
Background
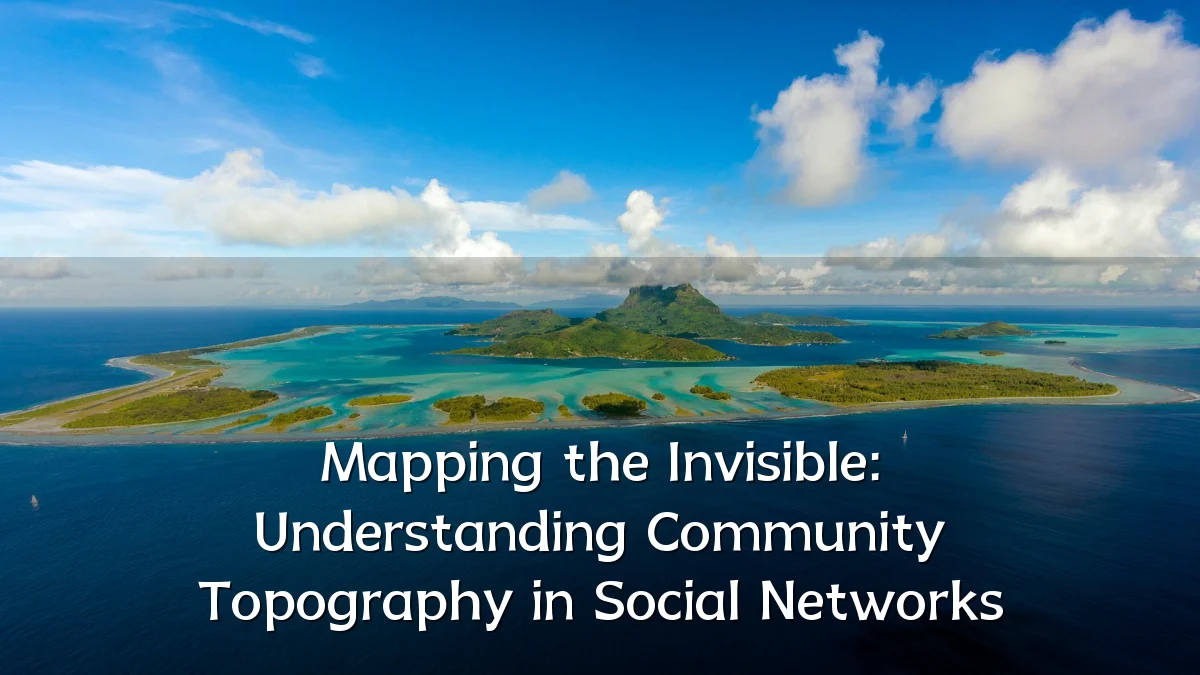
Community topography refers to the study of the relational landscape within social networks—how users, groups, and content nodes are arranged relative to one another. The concept borrows from geography and ecology: just as a map shows mountains, valleys, and plains, a social graph reveals densely connected cores (peaks), sparse bridging zones (valleys), and isolated individuals or groups (plateaus or islands). Early network analysis focused on simple metrics (density, diameter), but recent work incorporates dynamic topographic features—such as how paths of influence shift when a key user leaves or a controversial topic emerges. Understanding this topography helps explain why certain ideas spread rapidly while others die out in structural dead ends.

User Concerns
Everyday users are becoming more aware—and more wary—of how the invisible structure of their network affects what they see, who they interact with, and how their own content is received. Several common concerns have emerged:
- Algorithmic confinement – Concern that recommendation engines reinforce high-density clusters, limiting exposure to viewpoints or people outside one’s usual vicinity.
- Filter bubble blindness – Users may not realize they occupy a "topographic valley" isolated from broader conversations until a cross-platform event forces sudden exposure.
- Privacy of structure – The shape of one’s social graph can reveal sensitive information (e.g., religious or political affiliations, professional networks), even if individual posts remain private.
- Loss of serendipity – A landscape designed for efficient pathfinding may remove the chance encounters that make physical communities vibrant.
Likely Impact
As platforms refine their capacity to map and manipulate community topography, several practical outcomes are expected over the near term:
- Moderation strategies will increasingly rely on topographic signals—for example, removing a central bridge node to disrupt a harmful cluster, rather than targeting specific posts.
- Content virality will become more predictable but also more malleable: advertisers and activist groups alike will commission topographic audits to identify fertile ground for message spread.
- User autonomy tools may appear, letting individuals not only see the shape of their network but also flatten or diversify it by adjusting connection weights or algorithmic exposure.
- Regulatory attention could grow as lawmakers question whether underlying network topography—not just visible content—should be subject to transparency requirements.
What to Watch Next
Over the coming quarters, observers should keep an eye on the following developments in community topography:
- Whether major platforms publish optional network-mapping dashboards for users (similar to data-download tools but focused on relational structure).
- Research papers that propose standardized metrics for topographic features (e.g., "peak cohesion index," "valley permeability") to allow cross-platform comparison.
- Startups offering third-party network topography audits for individuals or organizations, potentially raising new privacy and ethics debates.
- How academic and civil society groups use topographic mapping to study political polarization, misinformation spread, and the resilience of communities under stress.